Beef Cuts Nutrition Chart: Calories, Protein, Fat
Calories, protein, fat and saturated fat in 19 cooked beef steaks, roasts and ground beef blends per 3 oz, from USDA data, with the lean cuts marked.

A 3 oz (85 g) serving of cooked beef has 139 to 400 calories in USDA FoodData Central, depending on the cut, while protein stays in a narrow band of about 18 to 26 g. Flank steak has 163 calories and 23.5 g of protein per 3 oz; ribeye has 247 calories and 20.1 g.
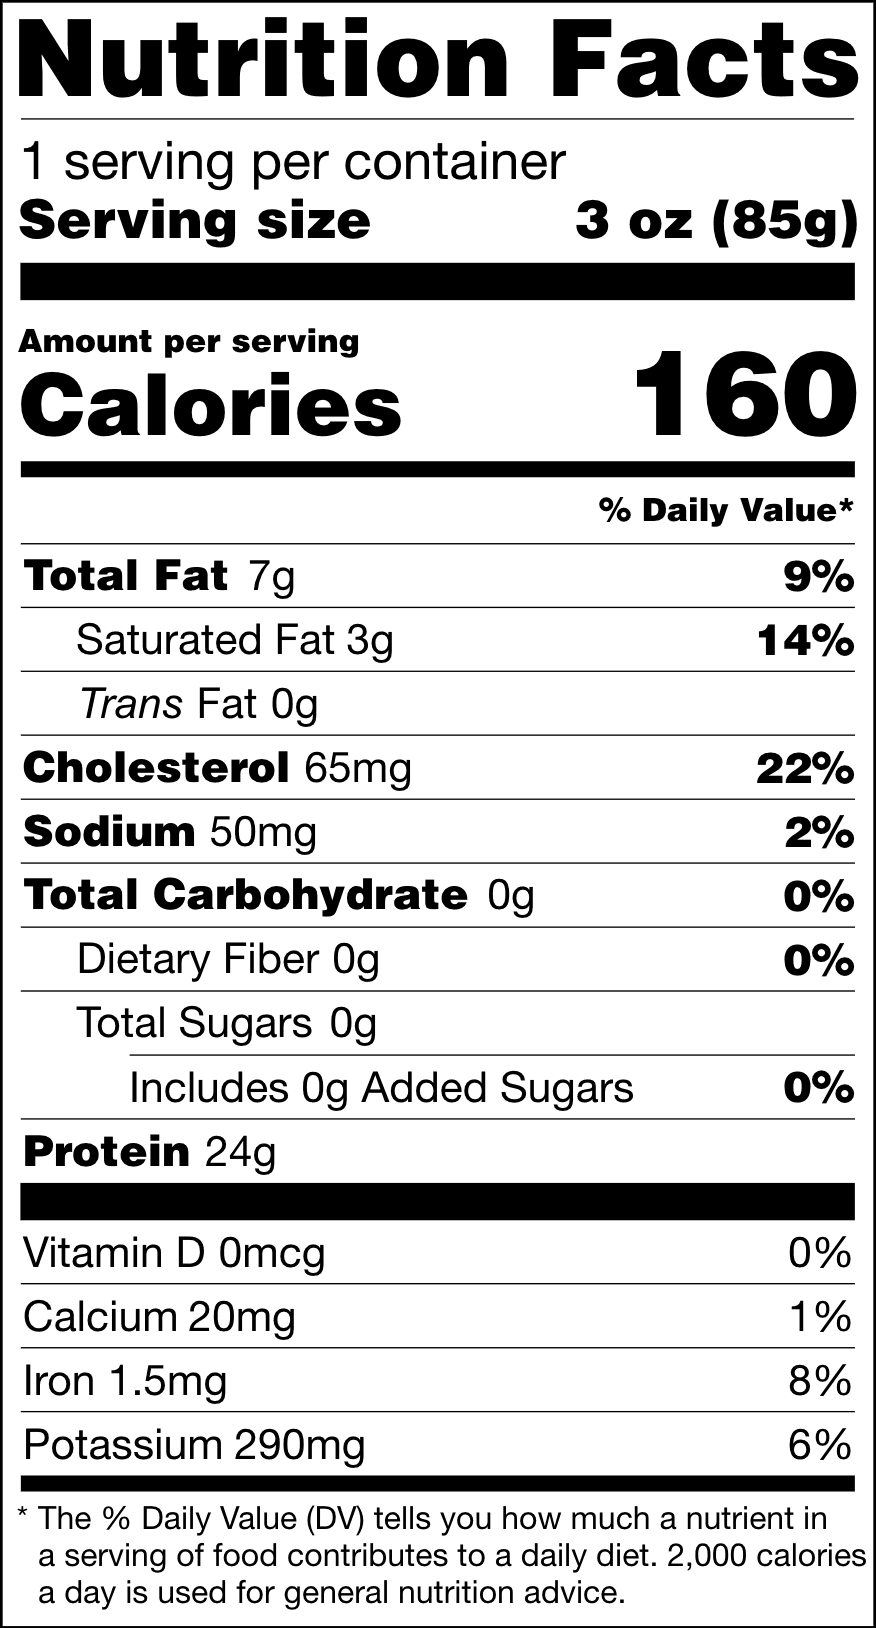
Fat is what separates the cuts. The charts below compare 19 cooked steaks, roasts and ground beef blends per 3 oz, sorted from fewest to most calories. Each cut links to its full nutrition page, where you can change the serving, see every nutrient and view the Nutrition Facts label.
Leanest and fattiest beef cuts
Per 3 oz cooked, the leanest cuts in this chart are 95% lean ground beef (139 calories, 5 g fat), top round steak (142 calories, 3.6 g fat), beef tenderloin (156 calories, 6.9 g fat) and flank steak (163 calories, 7 g fat). At the other end, short ribs have 400 calories and 35.7 g of fat, and brisket 281 calories.
Cuts from the round and the flank, which work hard on the animal, carry little marbling. Cuts from the rib and short loin (ribeye, strip, T-bone, porterhouse) are prized for marbling, and that intramuscular fat is where the extra calories come from.
Steaks: calories, protein and fat
| Cut (cooked) | Calories per 3 oz | Protein | Fat | Saturated fat | Calories per 100 g |
|---|---|---|---|---|---|
| Top Round Steak | 142 | 25.5 g | 3.6 g | 1.5 g | 167 |
| Flank Steak | 163 | 23.5 g | 7 g | 2.9 g | 192 |
| Filet Mignon | 179 | 25.9 g | 7.6 g | 3 g | 211 |
| Skirt Steak | 187 | 22.2 g | 10.2 g | 4 g | 220 |
| Round Steak | 200 | 23.4 g | 11 g | 4.2 g | 235 |
| Sirloin Steak | 206 | 22.1 g | 12.8 g | 4.5 g | 242 |
| New York Strip Steak | 224 | 22.3 g | 15 g | 5.9 g | 264 |
| Porterhouse Steak | 235 | 21.6 g | 15.8 g | 6.4 g | 276 |
| T-Bone Steak | 246 | 20.9 g | 17.3 g | 7.1 g | 289 |
| Ribeye Steak | 247 | 20.1 g | 18.5 g | 8.2 g | 291 |
Roasts and braising cuts: calories, protein and fat
| Cut (cooked) | Calories per 3 oz | Protein | Fat | Saturated fat | Calories per 100 g |
|---|---|---|---|---|---|
| Beef Tenderloin | 156 | 23.2 g | 6.9 g | 2.8 g | 183 |
| Tri-Tip | 179 | 22.1 g | 9.4 g | n/a | 211 |
| Chuck Roast | 257 | 25.6 g | 16.3 g | 6.5 g | 302 |
| Beef Brisket | 281 | 22 g | 20.8 g | 8 g | 331 |
| Beef Short Ribs | 400 | 18.3 g | 35.7 g | 15.1 g | 471 |
Ground beef: calories, protein and fat
| Cut (cooked) | Calories per 3 oz | Protein | Fat | Saturated fat | Calories per 100 g |
|---|---|---|---|---|---|
| 95% Lean Ground Beef | 139 | 21.9 g | 5 g | 2.2 g | 164 |
| 90% Lean Ground Beef | 173 | 21.4 g | 9.1 g | 3.6 g | 204 |
| Ground Beef | 197 | 20.9 g | 11.9 g | 4.5 g | 232 |
| 80% Lean Ground Beef | 209 | 20.4 g | 13.5 g | 5.1 g | 246 |
Which beef cuts are lean?
On a US label, "lean" means less than 10 g of fat, 4.5 g or less of saturated fat and less than 95 mg of cholesterol per 100 g and per serving; "extra lean" means less than 5 g of fat and less than 2 g of saturated fat. By these USDA records, 95% lean ground beef, top round steak, beef tenderloin, flank steak and filet mignon meet the lean numbers per 100 g cooked, and top round steak also meets extra lean. A packaged product can only make the claim if its own values qualify.
Ground beef works differently. A label can say 90% lean or 80% lean only together with the fat percentage (10% fat, 20% fat), because those blends do not meet the "lean" definition. Per 3 oz cooked, 95% lean has 139 calories and 80% lean 209, a difference of 70 calories with protein almost unchanged.
Highest-protein beef cuts
Per 100 g cooked, the most protein comes from filet mignon (30.5 g), chuck roast (30.1 g), top round steak (30 g) and flank steak (27.7 g). For other meats, poultry and fish, see the protein in meat and fish chart.
Raw weight or cooked weight
Every value here is for cooked beef, weighed after cooking. Steak loses roughly a quarter of its weight as water when cooked, so 4 oz raw becomes about 3 oz cooked, with more calories and protein per gram. Use raw weights with raw records (for example raw flank steak) or cooked weights with cooked records, never a mix.
Labeling a beef product
Meat and meat products are labeled under USDA FSIS rules rather than FDA rules, but the panel uses the same format and rounding. To label a product made with beef, such as a marinated steak, a burger patty or a beef chili, total the recipe in the recipe nutrition calculator and build the panel with the nutrition facts label generator.
Source and method
All values come from USDA FoodData Central, SR Legacy (April 2018), cooked records as named on each linked food page. Per 3 oz values use 85 g and are calculated from the per-100 g values, then rounded to 0.1 g (protein, fat) or 1 calorie. The lean check uses per-100 g fat, saturated fat and cholesterol from the same records; n/a means USDA reports no saturated fat value for that record.


